An LLM feature degrades on a Tuesday. No alert fires, no error rate moves, no dashboard turns red. Three weeks later a support ticket mentions that the summaries "got worse", and nobody can say when it started, because nothing in the system was measuring whether the output was any good.
This is the failure mode that makes LLM systems different. Traditional services fail loudly. A request errors, a latency histogram shifts, a queue backs up, and the on-call engineer has a signal within a minute. An LLM system fails by returning a confident, well-formed, completely wrong answer with a 200 OK and a normal p95.
Every metric you already have keeps looking fine. GPU utilization is fine. Error rate is fine. Token throughput is fine. The output is wrong. Nothing in your stack has an opinion about that, because correctness was never something your observability was built to measure.
What the standard dashboard cannot see
Most teams instrument the LLM as if it were one more HTTP dependency: request count, latency, error rate, token count. That gets you four blind spots.
Token counts without context. You know 4,000 tokens went in. You do not know that 3,000 of them were retrieved chunks, that six of the eight chunks were irrelevant, and that the useful one was truncated out of the window.
No visibility into the path. A response is slow or wrong. Was it retrieval, reranking, prompt assembly, the model call, a tool call, or the parsing step afterward? Without spans you are guessing, and with a multi-step agent you are guessing across a loop that ran nine times.
No automated quality measurement. Nothing in the system knows whether yesterday's answers were better than today's. The only quality signal is a user complaining, which arrives late and is not a metric.
No objectives for correctness or safety. You have an availability target. You have no target for how often the model is allowed to be wrong, which means no threshold, which means no alert.
The first two are tracing problems. The second two are evaluation problems. They need different machinery and teams routinely build one and assume they have covered both.
Trace the whole path, not the model call
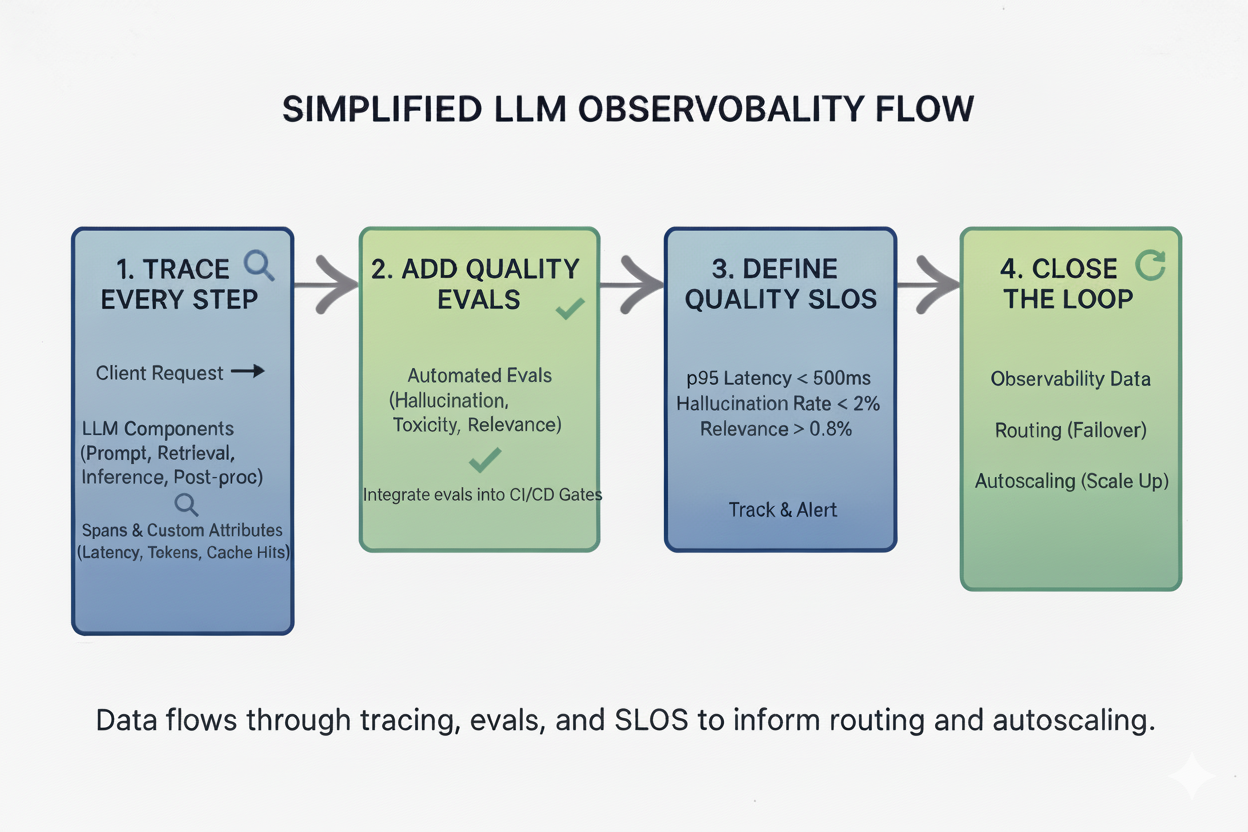
Instrument every stage as its own span: prompt assembly, retrieval, reranking, the inference call, tool and function calls, post-processing and parsing. OpenTelemetry handles this, and its semantic conventions for generative AI cover most of the attributes you want, so you are not inventing a private schema from scratch. Worth knowing that the gen_ai.* attributes are still marked as development status and have already moved repositories once, so pin what you depend on and expect some churn.
The span tree matters more than the individual timings. For anything agentic, one user request becomes a tree: a plan, four tool calls, two retrieval hops, a retry after a malformed response, a final synthesis. A flat log of model calls cannot express that. When an agent burns 40,000 tokens on a simple question, the tree tells you it looped on a tool that kept returning an error the model did not recognize as terminal. Flat logs tell you tokens were high.
Attributes worth attaching to every span, because these are what you will group by at 2am: model and exact version, prompt or template version, token counts split into input and output, cache hit or miss, retrieval scores and document identifiers, tool name and outcome, finish reason, and retry count.
Finish reason and prompt version carry more weight than they look like they should. A rise in length-capped completions is usually a truncation bug rather than a model regression. And if you cannot group quality by prompt version, you cannot attribute a regression to the prompt edit that caused it, which is where a large share of regressions come from.
Sampling needs a deliberate decision. Full-fidelity traces on every request are expensive at volume and the interesting requests are rare, so tail-based sampling is the usual answer: keep everything that errored, ran long, scored badly, or triggered a guardrail, and sample the rest. What you must not do is sample away the failures you built this to find.
One warning. Prompts and completions are user content. The moment you log them you have built a system that stores user data, possibly including personal information, in your tracing backend. Decide retention and redaction before you turn it on, not after someone asks.
Evaluate quality, because latency is not quality
Tracing tells you what happened and how long it took. It has nothing to say about whether the answer was correct. That needs evaluation, and evaluation needs to run in three places.
Offline, against a golden set
A golden dataset is a fixed set of inputs with known-good outputs or graded criteria. Small is fine to start. A few hundred well-chosen cases beat ten thousand scraped ones, because the value is in coverage of the cases you actually care about rather than in volume.
Build it from real traffic, not imagination. Pull the requests that failed, the ones users complained about, the edge cases that surprised you, and the boring high-volume path that must never break. Every incident should end with a new case added to the set, which is how the set stops being a snapshot and becomes a regression suite.
In CI, as a gate
Any change to a prompt, a model version, a retrieval parameter, or a chunking strategy runs against the golden set before it merges. Prompts are code and deserve the same treatment. A team that will not merge an untested function will happily edit a system prompt in a text box and ship it, and that asymmetry is where a lot of silent regressions come from.
Gate on a threshold, not on perfection. Generation is stochastic, so a small score movement is noise and blocking on it trains people to bypass the gate.
Online, on live traffic
Production sees inputs your golden set does not. Score a sample of live traffic continuously so drift is something you detect rather than something you hear about. This is also where implicit user signals earn their keep: did the user retry, rephrase, abandon the session, copy the answer, or thumbs-down it. None of those is a clean quality score and together they move earlier than any offline metric.
On judging with a model
Using a model to grade output is practical and has failure modes you need to know about. Judges prefer longer answers. They prefer their own family's style. They are sensitive to option order in pairwise comparisons, and they are lenient by default, so the first version of a judge tends to agree with everything.
Three things make them usable: a rubric specific enough that two humans would agree on the score, pairwise comparison against a reference rather than absolute 1-to-10 scoring, and a periodic human spot-check to confirm the judge still correlates with human judgment. Measure that correlation once before you trust the judge, because an uncalibrated judge does not produce no signal, it produces a confident wrong signal.
Deterministic checks are cheaper and better wherever they apply. Schema validity, required fields, citation presence, whether a claimed source actually contains the claim, refusal detection, regex on known-bad patterns. Use a model only for the part that genuinely needs judgment.
Define objectives you would actually page on
Examples worth starting from:
Time to first token under 500ms at p95
Unsupported-claim rate under 2 percent on the golden set
Retrieval relevance above 0.8 at the top rank
Schema validity above 99.5 percent for structured output
Guardrail trigger rate within a stated band
Two adjustments to how these usually get written. Split latency into time to first token and time per output token, because for a streaming interface those are separate experiences and one number hides which one broke. And define correctness objectives against a fixed evaluation set rather than live traffic, so the measurement does not move underneath you when traffic mix changes.
Then decide what pages and what does not. A slow drift in relevance is a ticket. A collapse in schema validity is a page, because something downstream is already broken. If every quality metric pages, the on-call rotation learns to ignore all of them.
Close the loop
Observability that only produces dashboards is a reporting system. The point is to feed it back into how the system behaves.
Route traffic away from a model version that is failing evals. Scale on the signal that reflects the real constraint, which is queue depth and batch occupancy rather than CPU. Fall back to a smaller model or a cached answer when latency objectives are breaching, and be explicit that this is a quality-for-availability trade rather than a free win. Feed low-scoring production cases back into the golden set so each failure is caught automatically next time.
Automate this carefully. An automatic rollback wired to a noisy eval will flap between versions, and a system that reroutes itself on a miscalibrated judge is worse than one that pages a human.
The trade-offs
Tracing costs overhead and storage. Span export is cheap, storing prompts and completions at volume is not. Tail-based sampling and honest retention are the levers.
Evals need good datasets. This is the real cost and it is human effort, not compute. There is no shortcut and it is the highest-return work here.
Model judges cost money and drift. Grading every request with a large model can cost more than serving it. Sample, and prefer deterministic checks where they work.
Objectives must balance cost and quality. A stringent latency target forces smaller batches and more GPUs. That is a business decision, so write it down as one.
What I would do first
Add OpenTelemetry spans for every stage, with model version, prompt version, token split, and finish reason as attributes. Build a golden set of 100 to 300 cases drawn from real traffic and real failures. Wire it into CI as a gate on prompt, model, and retrieval changes. Pick three or four objectives, split latency into first-token and per-token, and define correctness against the fixed set. Sample live traffic for continuous scoring, weighted toward requests that look unusual. Then route on what you measure.
Doing this in order matters, because each step makes the next one interpretable. Eval gates are the highest-leverage piece, and worth understanding why: they do not improve the model at all. They catch prompt and retrieval regressions before those reach a user, which is a different and cheaper kind of win than making the model better.
The honest summary is that observability for LLMs is two systems, not one. Tracing answers what the system did. Evaluation answers whether it was any good. Most teams build the first, ship, and then spend a quarter wondering why quality problems keep reaching users before they reach a dashboard.
References
OpenTelemetry, including the semantic conventions for generative AI
Published work on LLM-as-judge calibration and its known biases
Your own incident history, which is the best source of golden cases you have
Subscribe for weekly AI infra deep dives.