Why This Matters: LLM systems fail silently. Latency spikes, hallucinations, and broken prompts often go unnoticed until users complain. Traditional metrics like CPU or GPU utilization are not enough. You need observability that tracks the full request path and measures quality.
What Is Missing Today
Most LLM systems have poor observability. Teams rely on basic metrics that don't reveal the real issues:
- Token counts without context - Knowing you processed 10M tokens tells you nothing about quality or failures
- No visibility into prompt to retrieval to inference flow - You can't see where latency comes from or where failures happen
- No automated evals for quality - Manual spot-checks don't scale and miss systematic issues
- No SLOs for correctness or safety - Without quality targets, you're flying blind
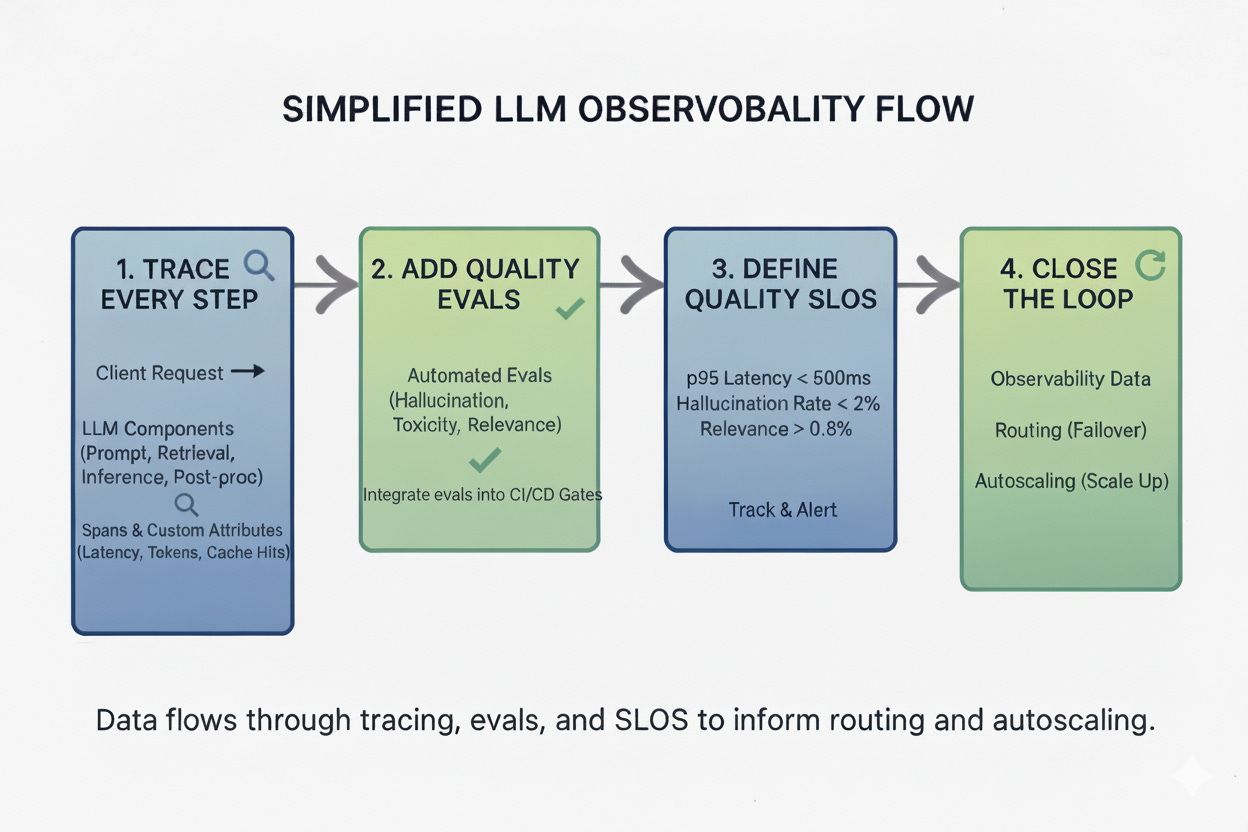
How to Build Real Observability
1. Trace Every Step
Distributed tracing is critical for understanding LLM systems. You need visibility into each stage of the request lifecycle.
Capture spans for:
- Prompt processing - Tokenization, template rendering, input validation
- Retrieval calls - Vector search, document fetching, reranking
- Model inference - Actual LLM call, including queue time and inference time
- Post-processing - Response formatting, output validation, safety checks
Use OpenTelemetry or similar frameworks. Add custom attributes like:
- Token count (input/output)
- Latency per stage
- Cache hits and misses
- Model version and configuration
- User context and request metadata
Pro tip: Don't just log - emit structured traces that you can query and aggregate. This lets you identify patterns like "90% of slow requests have retrieval latency > 200ms."
2. Add Quality Evals
Latency is not enough. You need correctness checks integrated into your pipeline.
Build automated evaluations for:
- Golden datasets - Regression tests with known good outputs
- Hallucination detection - Check if model outputs are grounded in context
- Toxicity and safety - Filter harmful or inappropriate responses
- Relevance scoring - Measure if responses actually answer the question
Integrate evals into CI/CD gates: Don't ship if hallucination rates spike or quality scores drop below thresholds.
3. Define Quality SLOs
Service Level Objectives (SLOs) are critical for production LLM systems. They define what "good enough" means and when to alert.
Example SLOs:
- p95 latency < 500 ms - Most requests should be fast
- Hallucination rate < 2% - Keep incorrect outputs low
- Retrieval relevance score > 0.8 - Ensure context quality
- Token cost per request < $0.01 - Control spending
- Availability > 99.9% - System uptime target
Track these in dashboards. Alert when thresholds break. Use error budgets to balance velocity with reliability - if you're spending your error budget too fast, slow down and fix quality issues before shipping new features.
4. Close the Loop
Observability data should drive automated decisions, not just dashboards.
Feed observability data back into your system:
- Route traffic away from failing models - If a model version has high error rates, automatically shift traffic to a stable version
- Scale up when latency breaches SLOs - Trigger autoscaling based on p95 latency, not just CPU
- Adjust cache policies - If cache hit rate drops, investigate and optimize caching strategies
- Trigger retraining - If quality metrics degrade over time, queue model updates
This creates a closed-loop system where observability informs operations automatically.
Trade-offs to Know
Building comprehensive observability comes with costs:
- More tracing means more overhead - Each span adds latency and storage costs. Be selective about what you trace.
- Evals need good datasets - Building high-quality golden datasets takes time and domain expertise.
- SLOs must balance cost and quality - Tighter SLOs mean higher infrastructure costs. Find the right balance for your use case.
- Alert fatigue is real - Too many alerts and teams will ignore them. Focus on actionable metrics.
Actionable Steps
Ready to improve your LLM observability? Here's where to start:
- Add OpenTelemetry spans for each stage - Start with the critical path: prompt → retrieval → inference → response
- Build a small golden dataset for evals - Start with 100-200 high-quality examples covering common cases and edge cases
- Define 3-4 quality SLOs and track them - Don't boil the ocean - pick the most important metrics and iterate
- Wire alerts into Slack or PagerDuty - Make sure the right people know when SLOs break
- Feed metrics into autoscaler and router - Close the loop by making observability data actionable
From my experience: Adding eval gates cut hallucination rates by 30%. Tracing revealed that 80% of slow requests were caused by retrieval latency, not inference. Quality SLOs helped balance cost and user experience.
References
- OpenTelemetry - Industry standard for distributed tracing
- LLM Evals by OpenAI - Guide to evaluating language models
- From my experience at Google, Uber, and Microsoft building AI/ML infrastructure at scale
Want to discuss LLM infrastructure?
I consult with companies on AI/ML infrastructure and engineering best practices.
Get in Touch